Key words: UPLC-Xevo TQ, herbicide, pesticide, PICS, ScanWave, Quanpedia
Foreword:
A method for the detection of 11 herbicide pesticides using the Waters UPLC-Xevo system was established. These 11 pesticides are quaternary ammonium salts with strong polar compounds. Waters ACQUITY BEH HILIC columns are used to achieve good retention of the test substances and to achieve better separation of these compounds. This method uses Xevo TQ's IntelliStart function to quickly and easily establish mass spectrometry methods, and uses PICS function to aid qualitative determination. For low concentration or low response compounds, ScanWave function is used to effectively enhance ionic strength, and Quantum library is automatically imported and exported to generate MRM method and liquid. The phase method realizes the rapid establishment of multi-residue detection methods.
experimental method
1 , materials, reagents and instruments
Acetonitrile is chromatographically pure, the experimental water is ultrapure water (18M Ω, TOC 3ppb), ammonium acetate is excellent grade, formic acid is excellent grade, ACQUITY UPLC ® ultra performance liquid chromatography system, Xevo TQ mass spectrometry system
2 , experimental conditions
2.1 UPLC Method Liquid Phase System: Waters ACQUITY UPLC®
Column: Acquity UPLC TM BEH HILIC 1.7 mm , 2.1 Ì 50mm , P/N: 186003460
Column temperature: 35 ÌŠC
Detection period: 4 min
Injection volume: 10ul
Mobile phase: A : 250m mol NH4AC +1.4%FA H2O pH=3.7 B : CH3CN ; Gradient elution weak wash solvent: acetonitrile / water = 90/10 , 900ul
Strong solvent: acetonitrile / water = 10/90, 300ul
The gradient method is shown in the table below:
Table 1 detection gradient table
Time | Flow | %A | %B | Curve |
0.00 | 0.500 | 7.0 | 93.0 | Initial |
1.80 | 0.500 | 40.0 | 60.0 | 6 |
2.00 | 0.500 | 50.0 | 50.0 | 6 |
4.00 | 0.500 | 7.0 | 93.0 | 1 |
2.2 Mass Spectrometry
MS system: Xevo TQ
Ionization mode: ESI+
Capillary voltage: 0.55KV
Source temperature: 150 ° C
Atomizing gas temperature: 450 ° C
Atomizing gas flow rate: 950L/h
Cone gas flow rate: 10 L/h
The mass spectrometric detection parameters are shown in Table 2.
Table 2 MRM (Multiple Reaction Monitoring) parameters and PtP signal-to-noise ratio of each pesticide retention time, name, chemical formula and its corresponding detection concentration
Chinese name | English name | Reaction | Cone/V | Collision/V | Dwell/s | Quantitative | Chemical formula | Detection concentration / ppb | PtP signal to noise ratio |
Mepiperidine | Mepiquat | 114.10>58.03 | 44.0 | 18.0 | 0.022 | C7H16NCl | 0.002 | 32.1 | |
114.10>98.17 | 44.0 | 18.0 | 0.022 | Quantitative | |||||
Toxic base | Tubocur Arine | 305.35>58.02 | 22.0 | 15.0 | 0.022 | C38H44 N2O6 | 0.450 | 14.1 | |
305.35>552.30 | 22.0 | 15.0 | 0.022 | Quantitative | |||||
Vecuronium bromide | Vecuro Nium | 515.53>100.06 | 52.0 | 40.0 | 0.022 | C34H57 BrN2O4 | 0.040 | 5.7 | |
515.53>356.36 | 52.0 | 36.0 | 0.022 | Quantitative | |||||
Chlormequat | Chlorom Equat | 122.03>62.92 | 36.0 | 18.0 | 0.022 | C5H13Cl2N | 0.004 | 100.4 | |
122.03>58.82 | 36.0 | 18.0 | 0.022 | Quantitative | |||||
Enemy fast | Diquat | 183.10>130.07 | 36.0 | 32.0 | 0.022 | C12H12N2 | 0.200 | 26.1 | |
183.10>157.07 | 36.0 | 22.0 | 0.022 | Quantitative | |||||
New methyl sulphate Siming | JLSX SDM | 223.16>208.10 | 32.0 | 20.0 | 0.022 | C12H19N2 O2-CH3SO4 | 0.001 | 107.6 | |
223.16>71.98 | 32.0 | 28.0 | 0.022 | Quantitative | |||||
Chlorinated amber Acylcholine | LHH PXDJ | 145.10>65.46 | 16.0 | 18.0 | 0.050 | C14H30Cl2 N2O4 | 1.000 | 36.3 | |
145.10>115.53 | 16.0 | 10.0 | 0.050 | Quantitative | |||||
Paraquat | Paraquat | 186.10>155.10 | 26.0 | 30.0 | 0.050 | C12H14N2 | 0.100 | 22.6 | |
186.10>171.09 | 26.0 | 18.0 | 0.050 | Quantitative | |||||
Ethyl amethyst | Ethyl viologen | 214.16>157.05 | 30.0 | 30.0 | 0.050 | C14H18 Br2N2 | 0.200 | 6.4 | |
214.16>185.08 | 30.0 | 20.0 | 0.050 | Quantitative | |||||
Oatmeal | Difenz Oquat | 249.16>193.05 | 40.0 | 26.0 | 0.078 | C18H20 N2O4S | 0.001 | 22.6 | |
249.16>130.12 | 40.0 | 38.0 | 0.078 | Quantitative | |||||
DDAC | DDAC | 326.37>57.23 | 42.0 | 32.0 | 0.078 | C22H48ClN | 0.005 | Super blank* | |
326.37>186.20 | 42.0 | 28.0 | 0.078 | Quantitative |
* : DDAC is included in the blank. The DDAC response exceeds the blank median value at 0.005 ppb, so this value is determined as the detection limit.
3 , data processing system
Masslynx 4.1 SCN729
Results and discussion
1. Standard Sample preparation
The mixture of 11 herbicides was diluted with 1/9 water-acetonitrile solution. 0.05 ug/ml matrix standard direct injection assay.
Extracted ion chromatograms and overlapping chromatograms of 2 and 11 herbicides
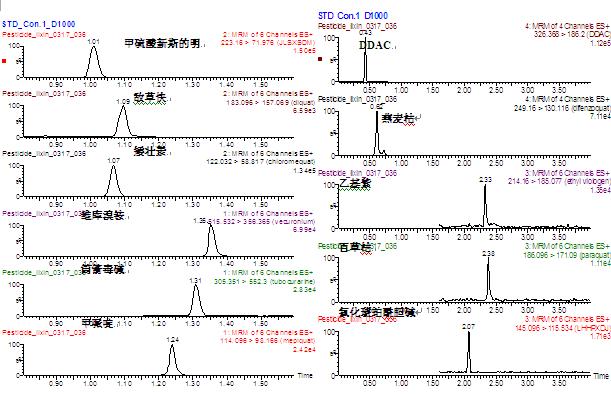
Figure 1 Quantitative ion chromatogram of 11 herbicide pesticides MRM detection
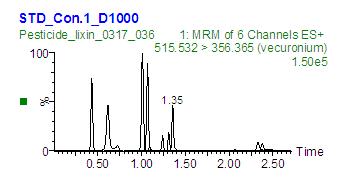
Figure 2 Total chromatograms of 11 herbicide pesticides
3 , 11 herbicide pesticide detection sensitivity, injection volume 10ul .
Using the developed UPLC-MS/MS method, 11 kinds of pesticides were mixed, and 11 pesticides had different sensitivity responses, so the detection limit of the lowest limit of quantitation (LOQ=10:1 SNR) was different. The PtP signal-to-noise ratio of each pesticide at its corresponding detection concentration, as well as the chemical formula, are shown in Table 2.
4 , product ion confirmation scan - PICS function - extended qualitative ability:
When collecting MRM data, set the threshold of the background noise level ( Threshold ). When the target compound response intensity exceeds this threshold, MS Scan, Daughter Scan, ScanWave MS Scan or ScanWave Daughter can be turned on. Scan. The ion confirmation scan results are obtained while obtaining the MRM quantitative peak, which expands the qualitative ability!
In the MRM plot of each pesticide standard, the PICS scan at the apex of the overshoot is obtained. Based on the parent and daughter ions of the analyte, it is easy to qualitatively determine which pesticide is the corresponding peak.
In addition, for compounds with only a single ion pair, the dual ion pair characterization is not possible, and the PICS function has a qualitative advantage.
In Figure 3 below, is the MRM PICS scan chromatogram of vecuronium bromide 515.5>356.4 ion pair. The PICS mass spectrum at 1.36min time is extracted from the MRM chromatogram (Figure 4 below), and vecuronium bromide By comparing the standard PICS spectrum or the MRM method, the peak is determined to be vecuronium bromide.
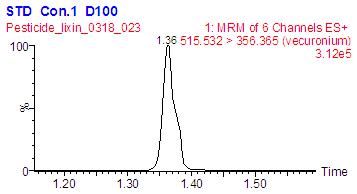
Figure 3 vecuronium bromide 515.5>356.4 ion pair chromatogram
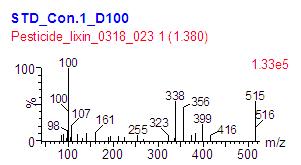
Figure 4 : Cobrium bromide 515.5>356.4 PICS scan mass spectrum
Using the TargetLynx software in MassLynx 4.1, you can compare the PICS spectrum obtained from the actual sample with the standard PICS Reference mass spectrum. The software calculates the Forward Fit and Reverse Fit values ​​to quantify the analytes in the sample and standard. The degree of matching.
Take 11 pesticide mixes as unknown samples. Figure 5 is the matching result of the vidocolamine PICS mass spectrum and the standard Reference spectrum in the sample. The sample can be qualitatively matched and MRM quantitative results can be obtained by one injection. Figure 6 shows the PICS spectra obtained for the 11 pesticides in the MRM assay.
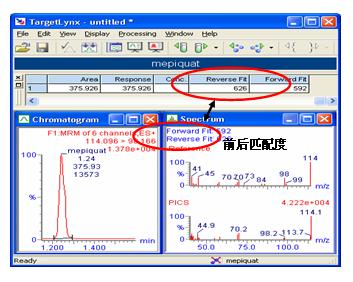
Figure 5 Matching of vidocyanium bromide PICS mass spectrum and standard Reference mass spectrum
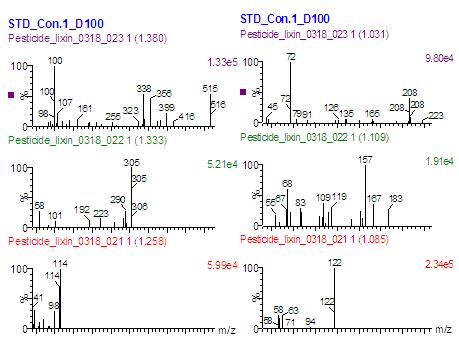
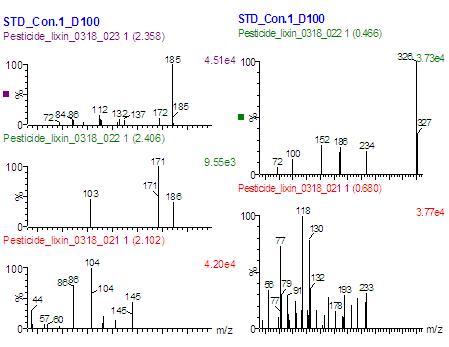
Figure 6 PICS spectra of 11 pesticides in MRM detection
5 , ScanWave signal enhancements
ScanWave is capable of enriching and releasing ions in the collision cell according to the charge-to-mass ratio (m/z), which significantly improves the sensitivity of SIR and MS scanning, and has a good application effect in the scanning of low-content analytes; It can be used simultaneously with the PICS function during the test to significantly enhance the PICS MS mass spectrometry signal or the daughter ion mass spectrometry signal.
Application Example 1, still taking vecuronium bromide (concentration of 20 ppb) as an example, performing two scanning experiments, Daughter Scan and ScanWave Daughter Scan, respectively.
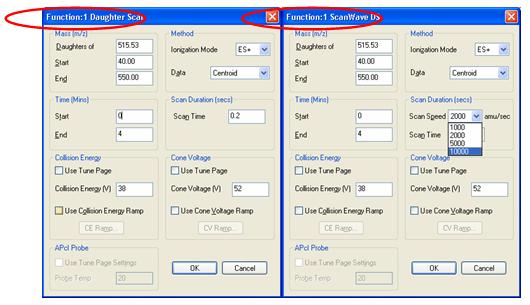
FIG 7 Daughter Scan ScanWave Daughter Scan both scans and methods
From the obtained ion scan chromatogram, it can be seen that the ScanWave Daughter Scan signal is more than 5 times stronger than the Daughter Scan signal (see Figure 8); at the same time, ScanWave Daughter can also be seen on the spectrum obtained from the two scanning methods. The mass spectrum signal of Scan is also five times higher (see Figure 9).
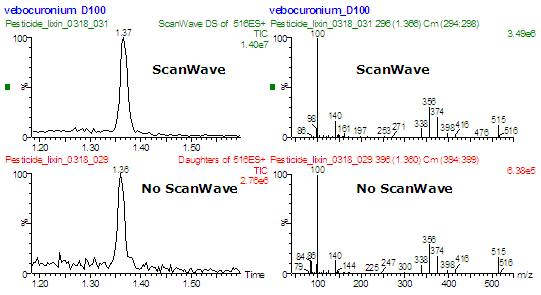
Figure 8 SanWave enhancer ion scan chromatogram signal Figure 9 SanWave enhancer ion mass spectrum signal
Application Example 2, while using MRM detection, combined with MRM detection and PICS function, significantly enhanced the sensitivity of PICS ion scans by more than 7 times (see Figure 10); meanwhile, due to the ultra-fast scan rate of Xevo TQ, In MRM, ScanWave does not affect the MRM signal strength and does not affect the accuracy of MRM quantification.
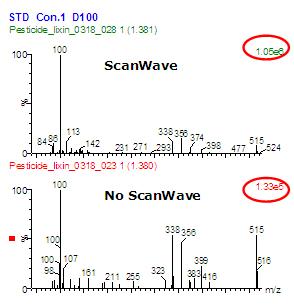
Figure 10 SanWave enhanced PICS ion mass spectrometry signal in MRM method
This feature can also be applied to signal enhancement in the full scan function.
7 , Quanpedia method library
Quanpedia is a library of methods that automatically select established LC methods (including mobile phase, gradient methods, columns, etc.), MRM methods, quantitative methods, and injections based on compound names or compound classes in the database. Sequence method. It is also possible to self-import the user's existing UPLC-MS/MS method, supplement and enrich the data volume of the database for rapid screening of compounds of interest.
Here, the established UPLC-MS/MS detection methods for these 11 pesticides are imported into the database and can be passed on different UPLC-Xevo TQ systems. The UPLC-MS/MS detection method is generated by the database, and the compound can be quickly screened without standard materials.
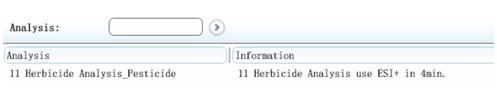
Figure 6 Quanpedia database method to introduce 11 pesticide UPLC-MS/MS detection methods
There are already more than 910 common compound detection methods in the Quanstro database of Waters' current UPLC-Xevo TQ system.
in conclusion:
This paper established a quantitative analysis method for the detection of 11 herbicide pesticides using the Waters UPLC-Xevo system. Detection limit of the method: Five compounds reached the pg/ml level. With the PICS function of the Xevo TQ, each compound is applied to the MRM test while applying the PICS function to aid in characterization.
In low- or low-sensitivity analytes, ScanWave is capable of enriching and releasing ions in the collision cell based on the charge-to-mass ratio (m/z), significantly improving the sensitivity of MS scans and daughter scans; and in MRM scans, Used in conjunction with the PICS function to significantly enhance the PICS MS MS signal or the Daughter MS signal without affecting the quantitation results.
The QuanM library automatically generates MRM methods for UPLC-MS/MS detection, allowing rapid screening of compounds of interest without the need for standards.
Eastony Industries (NingBo) Co., LTD. , https://www.eastony.com